Shanghai 15th People's Hospital,Shanghai 200233,China.
And now work department of gynecology in the fifth afflicted hospital of Sun Yat-sen university,52 East meihua road,Zhuhai 519000,China.
Abstract
Objective:To investigate the association between changes in body composition components during pregnancy and the risk of gestational diabetes mellitus(GDM).
Methods:A total of 996 pregnant women participated in the body composition measurement before 28 weeks’gestation(WG)finally recruited into a retrospective cohort study from July 2015 to March 2019.The complete statistical data were collected from hospital electronic medical record system and analyzed in R environment and SPSS.Logistic regression analysis was employed to explore the relationships between maternal body composition and the risk of GDM morbidity.
Results:Logistic regression analysis showed multiple predisposing factors of GDM may be:age≥35 years old,pre-pregnancy BMI≥28 kg/m2,body fat mass percentage(FMP)≥24.63%,intracellular fluid≥12.795kg before 28 weeks of pregnancy.In pregnant women with FMP≥24.63%,the incidence of GDM was 39.80%and dystocia(54.89%),postpartum hemorrhage(15.79%),macrosomia(14.67%),which were significantly higher than in the lower FMP group.
Conclusion:Body composition analysis can be a simple,convenient and noninvasive method used for weight monitoring during pregnancy and risk assessment of GDM occurrence.
Key words:Body composition;body fat mass percentage;body fat mass;Gestational diabetes mellitus
1.Introduction
The weight of pregnant women increases gradually during the whole pregnancy to supply fetus,and their body composition changes also.Body mass index(BMI)is a rough parameter for evaluating the weight gain.Body composition analysis is a method to reflect the consist of human body accurately,which offer chance to analyze objectively and rationally of body composition of pregnant women.Body composition was assessed by two-component model first established by Behnke
[1]in 1942 and gradually developing to multi-component models such as three,four component and five component.The five component model of human body composition is the most influential proposed by Wang et al[2]in 1992,which is comprised of five basic components:body fat mass(FM),extracellular fluid,intracellular fluid,inorganic salt and protein.The relationship between them is that the sum of intracellular fluid and extracellular fluid is total water,the sum of total water and protein mass is muscle mass,and the sum of muscle mass and inorganic salt is fat free body mass,and the sum of fat free body mass and body fat is the total body weight.Body fat mass percentage(FMP)is the ratio of body fat mass to body weight.Body composition analysis of pregnant women can better understand the specific content of pregnant women's weight change but there was less clinical application in prenatal diseases.
Gestational diabetes mellitus(GDM)is defined as the first degree of abnormal glucose tolerance during pregnancy and it has adverse impacts on the pregnancy process and maternal-fetal outcomes such as abortion,dystocia,postpartum hemorrhage,macrosomia[3-5].In the past decades,gestational diabetes mellitus has become one of the major complications of pregnant women with reported morbidity in Southwest China as high as 24.5%[6]and its prevalence rate trends to rise[7-8].The risk of GDM is affected by gestational age and pre pregnancy mass index,and the prevalence increases with the increase of gestational age and pre pregnancy mass index[9-11].
Body composition analysis may be a invasive and feasible method for evaluation of the potential risk of GDM.At present,the main method to diagnose GDM is oral glucose tolerance test(OGTT)at 24-28 weeks[12],but before OGTT to identify the risk of GDM is inconclusive.Therefore,this study is aim to study the clinical application value of body composition analysis in the risk assessment of GDM before OGTT.
2.Subjects and methods
2.1 Subjects
Pregnant women who taken regular prenatal examination and delivered in the department of obstetrics in the Sixth People's Hospital Affiliated to Shanghai Jiaotong University were included in our study(n=1691).The exclusion criterion for our study were failure to complete OGTT(n=95),inpidual record is not complete(n=448)or lost to follow-up(n=152),used drugs affected glucose or glucose metabolism(n=25).
2.2 Methods
Data collected from first prenatal examination to delivery in hospital electronic medical record system and outpatient measurement record,including age,height,number of pregnancies,number of births,pre-pregnancy weight,75 g oral glucose tolerance test(OGTT)results,body composition analysis report,pre-delivery weight,delivery,postpartum hemorrhage,neonatal weight.Measurements of the body composition analysis used the bio-electrical impedance analysis(BIA)(NQA-Pplus,Sihai Huachen Technology Co.Ltd,Shanxi,China)for inpidual nutrition detection in the department of nutrition in Shanghai Jiao Tong University Affiliated Sixth People’s Hospital.Evaluations were performed before screening for GDM diagnosed by OGTT during 24-28 WG(fasting:5.1 mmol/L,1 h:10.0 mmol/L,and 2 h:8.5 mmol/L).Informed consent was waived because of observational nature of the study[13].
2.3 Grouping
Subjects were distributed according to the different gestational weeks:early pregnancy(8-13 weeks+6 days),middle pregnancy(14-23 weeks+6 days),middle-late pregnancy(24-28 weeks).Pregnant women were pided into the common control group(n=840)and GDM group(n=156).The common control groups were pided into three groups:the controls in early pregnancy(Con1,n=563),in middle pregnancy(Con2,n=187),in middle-late pregnancy(Con3,n=90).Similar to the controls,three subgroups branched from the GDM group:early pregnancy(GDM1,n=42),middle pregnancy(GDM2,n=86)and middle-late pregnancy(GDM3,n=28).
Body mass index(BMI)was calculated used piding weight by the square of height(kg/m2),and fidelity was 0.1 kg/m2.BMI<18.5 kg/m2 was classified as lean,18.5-24 kg/m2 as normal,24-28 kg/m2 as overweight,and>28 kg/m2 as obese,according to the BMI classification for Chinese[14].According to different pre-pregnancy BMI calculated in body composition measurement before 28 WG,women were pided into ConBMI1 group(common pregnant women with pre-pregnancy BMI<18.5 kg/m2,n=124),ConBMI2 group(common pregnant women with pre-pregnancy BMI 18.5-23.9 kg/m
2,n=448),ConBMI3 group(common pregnant women with BMI 24-27.9 kg/m2,n=228),GDMBMI1 group(GDM pregnant women with BMI<18.5 kg/m2,n=24),GDMBMI12 group(GDM pregnant women with BMI 18.5-23.9 kg/m2,n=84),GDMBMI3 group(GDM pregnant women with BMI≥24 kg/m2,n=56).A high pre-pregnancy BMI and excessive gestational weight gain influence maternal and fetal outcomes[15-16].To further investigate,according to pre-delivery BMI calculated within fortnight before delivery,subjects with paired design were pided into ConBMI4 group(common pregnant women with pre-delivery BMI<24 kg>,n=563),ConBMI5(common pregnant women with pre-deliveryBMI 24-27.9 kg/m2,n=158),ConBMI6(common pregnant women with pre-deliveryBMI≥28 kg/m2,n=119)and GDMBMI4 group(GDM pregnant women with pre-delivery BMI<24kg/m2,n=93),GDMBMI5 group(GDM pregnant women with pre-delivery BMI of 24-27.9 kg/m2,n=45)and GDMBMI6 group(GDM pregnant women with pre-deliveryBMI≥28 kg/m2,n=18).
2.4 Statistical analysis
Kolmogorov Smirnov non-parametric rank sum test was used to test the normality
distribution of continuous variables.Data conforming to the normal distribution was expressed by mean±standard deviation(X±SD)and compared using t test.Categorical variables were expressed by median(25%,75%)or number of cases(proportion)and statistical inference was made by Chi square test or Fisher’s exact test as appropriate.Wilcoxon rank–sum tests was used for comparison throughout this study.Kruskal Wallis nonparametric rank sum test was used to compare the body fat mass percentage(FMP)of the common and the GDM pregnant women in different pregnancy periods.Multiple logistic regression model was used to evaluate the effect of body composition,pre-pregnancy BMI,age and other factors on the risk assessment of GDM.Data were analyzed by R environment(version 3.6.0)and SPSS(version 21.0)statistical software.P<0.05 was considered statistically significant.
3.Result
3.1 Subject Characteristics
According to inclusion and exclusion criterion,
996 pregnant women obtained with complete pregnancy and childbirth data included in this study,including 840 healthy women and 156 pregnant women with GDM.The subject characteristics are shown in Table 1.Compared with the control group,the age,pre-pregnancy weight and BMI,pre-delivery weight and BMI and neonatal weight of the GDM were significantly higher than in the control group(P<0.05).
Table 1. Characteristics of the subjects enrolled in the cohort
control group (n=840) | GDM group (n=156) | P value | |
pregnant age (years) <35 year-old ≥35 year-old | 29.6±4.31 687(81.79%) 153(18.21%) | 31.86±4.64 115(73.72%) 41(26.28%) | 0.003349** 0.043* 0.012* |
body height (cm) | 161.1±4.91 | 160.9±4.93 | 0.7092 |
time of pregnancy | 1.80±0.90 | 2.20±0.86 | 0.6751 |
delivery | 0.35±0.20 | 0.80±0.43 | 0.4544 |
gravidity (n/%) none one or more | 637(75.83%) 203(24.17%) | 102(65.38%) 54(34.62%) | 0.854 0.671 |
pre-pregnancy weight (kg) | 54.52±8.09 | 57.64±8.86 | 0.0001821** |
pre-pregnancy BMI(kg/m2) | 20.98±2.76 | 22.24±3.08 | 0.0004173** |
pre-delivery weight (kg) | 63.12±5.61 | 68.93±7.80 | 0.00108* |
pre-delivery BMI (kg/m2) | 26.41±3.02 | 28.54±3.21 | 0.00242* |
postpartum hemorrhage (ml) | 340.4±151.0 | 359.6±157.6 | 0.1881 |
way of delivery(n/%) vaginal birth forceps midwifery cesarean | 658(78.33%) 18(2.14%) 164(19.53%) | 88(56.41%) 9(5.77%) 59(37.82%) | 0.878 0.672 0.511 |
neonatal birth weight (g) | 2665±1369 | 2963±1225 | 0.01163* |
Note. PPH: postpartum hemorrhage, n(%): cases (proportion), * P <0.05,** P< 0.001
3.2 Reference ranges of body composition in different pregnancy periods
Reference ranges were ranged from 5%to 95%of every component of body composition measured 840 common pregnant women(Table 2).From first pregnancy to second pregnancy,the body composition of healthy pregnant women was mainly increased in protein.Before 24 weeks of gestation,the body composition mainly increased in body fat mass,body fat mass percentage(FMP),protein and overall water(P<0.05).Particularly,compared with first trimester,FMP of healthy pregnant women increased significantly in second trimester,whereas the GDM pregnant women keep steadily high.But into the third trimester,FMP of the control women and GDM pregnant women were at the approximate level.
Table 2 Reference range of body composition in different pregnancy periods
11-13 WG(n=563) | 14-23 WG (n=187) | 24-28 WG (n=90) | total(n=840) | |
free fat mass (kg) | 40.43±3.51 | 40.78±3.81 | 44.84±5.39*▲ | 40.91±3.96 |
free fat mass (kg) | 35.89±4.0 | 36.27±4.30 | 41.34±5.93*▲ | 36.48±4.42 |
total body water(kg) | 28.56±3.36 | 28.29±3.30* | 32.24±4.62*▲ | 28.45±3.45 |
ICW(kg) | 15.56±2.10 | 15.75±2.18 | 18.17±2.87*▲ | 15.25±2.27 |
ECW(kg) | 12.81±1.80 | 12.82±1.79 | 14.56±2.4*▲ | 12.69±3.24 |
protein(kg) | 7.74±0.94 | 7.98±0.80* | 9.21±1.30*▲ | 8.03±0.97 |
inorganic salts(kg) | 4.54±0.90 | 4.39±1.11 | 3.48±1.18*▲ | 4.43±1.07 |
FFM(kg) | 14.87±5.14 | 15.19±5.58* | 19.59±5.80*▲ | 15.23±5.40 |
FMP(%) | 22±5.05 | 23.02±1.51* | 26.58±4.69*▲ | 23.44±3.42 |
Note: WG: week of gestation, ICW: intracellular fluid, ECW: extracellular fluid, FFM: free fat mass, FMP: fat mass percentage. *p<0.05 vs 11-13WG,▲p<0.05 vs 14-23WG
3.3 Comparison of body composition between the control and GDM group women
Comparing the body components before 28 weeks of gestation,except for inorganic salts,the body components(total body water(consist of intracellular fluid(ICW),extracellular fluid(ECW)),free fat mass(consist of protein,muscular mass),body fat mass(FM)and FMP)of GDM women group were higher than those in the control group(P<0.05).Especially,FM and FMP were remarkably significant differences between the control and GDM group(P<0.001)(Table 3).
Table 3. Comparison of body composition between the control and GDM group women
control (n=840) | GDM (n=156) | P value | |
free fat mass (kg) | 40.91±3.96 | 2.07±4.27 | 0.00215 ** |
muscular mass(kg) | 36.48±4.42 | 37.75±4.67 | 0.00233 ** |
total body water(kg) | 28.45±3.45 | 29.45±3.65 | 0.00234 ** |
ICW(kg) | 15.25±2.27 | 16.21±0.40 | 0.0349 * |
ECW(kg) | 12.69±3.24 | 13.23±1.88 | 0.00142 ** |
protein(kg) | 8.03±0.97 | 8.31±1.03 | 0.00233 ** |
inorganic salts(kg) | 4.43±1.07 | 4.31±1.17 | 0.242 |
FM(kg) | 15.23±5.40 | 18.21±6.00 | 0.0000109 *** |
FMP(%) | 23.44±3.42 | 26.53±5.43 | 0.00000169 *** |
Note. ICW: intracellular fluid, ECW: extracellular fluid, FFM: free fat mass, FMP: fat mass percentage. * P <0.05,** P< 0.001
3.4 Comparison of FMP in different pregnancy periods between the control and GDM group
Table 2 showed that the fat mass gradually increases with gestational weeks,especially in GDM women increased earlier and faster than that of the control.Therefore,the differences of FMP between the control and GDM group under different conditions were
further discussed.
Kruskal Wallis non-parametric rank sum test was used to compare FMP of the six groups(Figure 1).Compared with the early pregnancy,FMP of GDM women was significantly different with the control(P=0.012),indicating that FMP of GDM women was higher than the control level in the early pregnancy or earlier.Before 14-24 weeks,FMP has no significant difference in GDM group and normal group(P=0.55 in control and P=0.087 in GDM).In contrast,FMP has significant difference between middle-late pregnancy and early pregnancy(P=0.0008 in the control and P=0.0034 in GDM group respectively),indicating that FMP during pregnancy increased significantly in both the control and GDM women.Compared with the middle pregnancy,FMP of normal pregnant women in the middle-late pregnancy increased significantly compared with in the second trimester of pregnancy(P=0.00091),whereas GDM women have no difference(P=0.1),indicating that the increase of FMP of normal pregnant women was mainly in the middle-late pregnancy rather than in the first trimester of pregnancy.This was also indicated that FMP between GDM group and normal group in the second trimester of pregnancy has significant difference(P<0.0001),whereas between GDM group and normal group have no significant difference(P=0.21),showed that FMP in the control and GDM pregnant women in the second and third trimester of pregnancy was roughly the same level.
The body composition was compared with the gestation going.In healthy pregnant women,there was no significant difference in FMP between early pregnancy and middle pregnancy(P=0.55).While middle pregnancy to middle-late pregnancy has significant change(P=0.00091)and between early pregnancy and middle-late pregnancy(P=0.0008).In GDM women,there was no difference in FMP between early pregnancy and middle pregnancy(P=0.087),and between middle pregnancy and middle-late pregnancy(P=0.1),but there was a difference from early pregnancy to middle-late pregnancy(P=0.0034).
Compared the same pregnancy stage,FMP has significant difference in early and middle pregnancy between common pregnant women and GDM pregnant women group(P=0.012 in early pregnancy and P=0.00000019 in middle pregnancy).In the middle-late pregnancy,the body fat mass of normal pregnant women and GDM women increased to a appropriate level without statistical difference(P=0.21).

Fig 1.Comparison and change of body fat mass percentage(FMP)in different pregnancy
Note:Con1:the controls in early pregnancy,Con2:the controls in middle pregnancy,Con3:the controls in middle-late pregnancy,GDM1:the GDM women in early pregnancy,GDM2:the GDM women in middle pregnancy,GDM3:the GDM women in middle-late pregnancy.
3.5 Comparison of body fat mass percentage(FMP)of between women with different pre pregnancy BMI
Based on different pre pregnancy BMI,I grouped the subjects in healthy and GDM pregnant women(Table 5).Kruskal Wallis nonparametric rank sum test was used to compare the body fat mass percentage(FMP)between the above two groups.(Figure 2).Taking the lean normal group(ConBMI1)as the benchmark,it can be found that only the lean control group(ConBMI1)and the lean GDM group(GDMBMI1)have no significant difference in body fat mass percentage(FMP)(P=0.28).The other groups are compared in pairs,including the lean and the normal BMI women in control group,the lean control group and the overweight obesity control group,the control weight control group and the control weight GDM group.There was significant difference between overweight group and obese control group(GDM<0.01),which indicated that FMP had predictive values of being a risk factors of GDM in women with pre pregnancy BMI<18.5kg/m2.
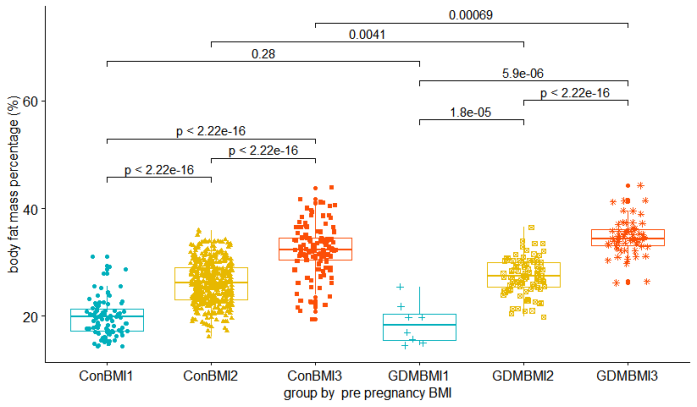
Fig 2.body fat mass percentage(FMP)of pregnant women in different pre-pregnancy BMI
Note.ConBMI1:the control group women with pre-pregnancy BMI<18.5 kg/m2,ConBMI2:the control group women with pre-pregnancy BMI 24-27.9 kg/m2,ConBMI3:the control group women with pre-pregnancy BMI I≥28 kg/m2,GDMBMI1:GDM pregnant women with pre-pregnancy BMI<18.5 kg/m2,GDMBMI2:GDM pregnant women with pre-pregnancy BMI 24-27.9 kg/m2,and GDMBMI3:GDM pregnant women with pre-pregnancy BMI≥28 kg/m2.
3.6 Comparison of FMP between women with different prenatal BMI
Kruskal Wallis non-parametric rank sum test was used to compare the body fat mass percentage(FMP)between the groups(Figure 3).FMP between prenatal overweight(24≤BMI<30kg>
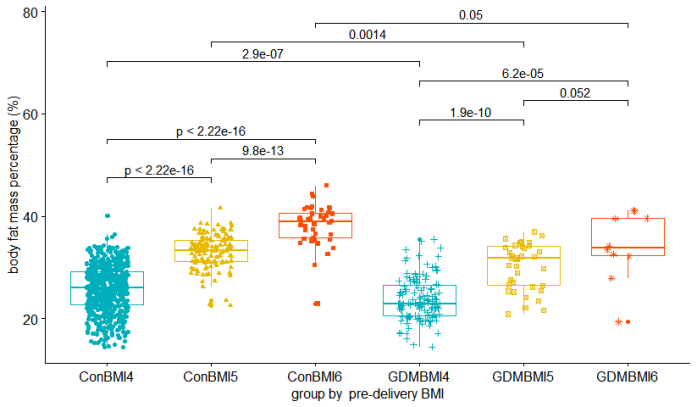
Fig 3.body fat mass percentage(FMP)of pregnant women in different pre-delivery BMI
Note.ConBMI1:the control group women with pre-delivery BMI<18.5 kg/m2,ConBMI2:the control group women with pre-delivery BMI 24-27.9 kg/m2,ConBMI3:the control group women with pre-delivery BMI I≥28 kg/m2,GDMBMI1:GDM pregnant women with pre-delivery BMI<18.5 kg/m2,GDMBMI2:GDM pregnant women with pre-delivery BMI 24-27.9 kg/m2,and GDMBMI3:GDM pregnant women with pre-delivery BMI≥28 kg/m2.
3.7 ROC curve of body components to evaluate the risk of GDM
To obtain cut-off values,I defined GDM as the dependent variable,body composition with differences(see in table 2)as dependent variables to draw receiver-operating characteristic(ROC)curves.Areas under receiver-operating characteristic curves(AUCs)were determined with standard linear regression using one-standard error rule method.The maximum AUCs of GDM judged by FMP was 0.621,the corresponding cut-off value was 24.63%(sensitivity(SE)86.0%,specificity(SP)35.8%),indicating that when FMP was as high as 24.63%,the sensitivity and specificity of GDM are 86.0%and 35.8%(Fig.5).The maximum AUCs of GDM judged by body fat mass was 0.61(cut-off value was 13.500kg,SE 79.3%,SP 40.2%)(Fig.4),judged by intracellular fluid(ICW)was 0.545(cut-off value 14.810kg,SE 71.1%,SP 40.7%),judged by extracellular fluid(ECW)was 0.544(cut-off value 12.795kg,SE 48.2%,SP 61.2%),judged by total body water was 0.544(cut-off value 27.745kg,SE 64.5%,SP 46.9%),judged by protein was 0.544(cut-off value 7.825kg,SE 64.5%,SP 46.9%),judged by muscular mass was 0.544(cut-off value 35.570kg,SE 64.5%SP 46.9%).
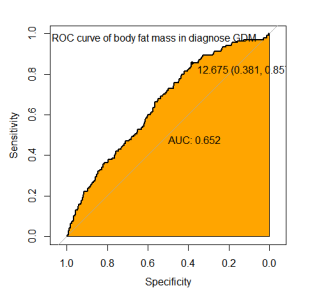
Fig 4.ROC curve of body fat mass in diagnose GDM
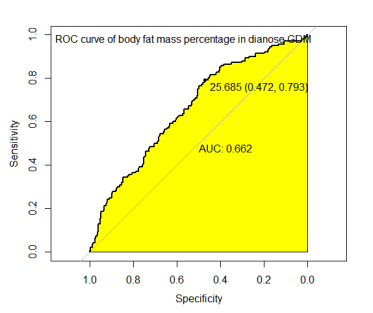
Fig 5.ROC curve of body fat mass percentage (FMP) in diagnose GDM
3.8 Logistic regression analysis of multiple risk factors of GDM
According to the above research,the cut-off value of factors with statistical differences between the control and GDM group are obtained by ROC curve,namely age≥35 years old,pre-pregnancy BMI≥28 kg/m2,FMP≥24.63%,FM≥13.5kg,intracellular fluid≥14.81kg,extracellular fluid volume≥12.795kg,total water≥35.57kg,protein≥7.825kg.Taking age,pre pregnancy BMI,FMP,body fat mass,intracellular fluid,extracellular fluid,total water,protein and other body components as independent variables and GDM as dependent variables,using nonparametric logistic multiple regression analysis,we obtained parameters and their confidence index(CI),namely the age(OR 2.03,95%CI(1.30,3.14),P
=0.00168**),body fat mass percentage(FMP)(OR=1.14,95%confidence interval(CI)(1.07,1.21),P=0.0000139770***),pre-pregnancy BMI(OR 2.30,95%CI(1.80,2.44),P=0.00062**),intracellular fluid(OR=1.32,95%CI(1.01,1.75),P=0.49*).
According to the logistic nonparametric regression model,after adjusting for other insignificant or interactive effects,the≥35 year-old pregnant women has 2.03 times higher risk of GDM than<35yr pregnant women,the overweight or obese pregnant women has 2.30 times higher risk of GDM than that in normal pregnant women,the pregnant women with high FMP(≥24.63%)has 1.14 times higher risk of GDM than that in normal pregnant women.Age≥35 years old,pre-pregnancy BMI≥28 kg/m2,FMP≥24.63%,intracellular fluid≥14.81 kg can be marked as the high-risk factors of GDM before 28 weeks of pregnancy.
3.9 pregnancy outcomes in different FMP women
In this study,the control pregnant women have 669(80.95%)cases FMP<24.63%,whereas≥24.63%have 171(19.45%).Women with GDM only have 50 cases(32.05%)cases the FMP<24.63%,whereas≥24.63%have 106(67.95%).
In terms to delivery,between women with body fat mass percentage(FMP)<24.63%and≥24.63%,spontaneous delivery have 626 subjects(85.75%)and 120 cases(45.11%),delivery assisted by forceps have 9 cases(1.23%)and 18 cases(6.77%),cesarean have 95 cases(13.01%)and 128 cases(48.12%),respectively.In terms to pregnancy outcome,between women with body fat mass percentage(FMP)<24.63%and≥24.63%,postpartum hemorrhage have 15 cases(2.05%)and 42 cases(15.79%),delivery macrosomia have 8 cases(1.10%)and 10 cases(3.76%),cesarean have 95 cases(13.01%)and 128 cases(48.12%),respectively.It is a statistic difference in postpartum hemorrhage(P=0.013*)and infant birth weight(macrosomia newborns P=0.001,low birth weight newborns P=0.047*).(Table 7)
Table 7 pregnancy outcomes in different body fat mass percentage (FMP) group
FMP<24.63% (n=730) | FMP≥24.63%(n=266) | P value | |
subjects(n/%) control GDM | 680(93.15%) 50(6.85%) | 160(60.20%) 106(39.80%) | 0.043* 0.054 |
delivery(n/%) spontaneous delivery assisted by forceps cesarean | 626(85.75%) 9(1.23%) 95(13.01%) | 120(45.11%) 18(6.77%) 128(48.12%) | 0.009** 0.012* 0.0045** |
postpartum hemorrhage(n/%) | 15(2.05%) | 42(15.79%) | 0.013* |
macrosomia(n/%) | 15(2.05%) | 39(14.67%) | 0.001** |
low birth weight newborns(n/%) | 8(1.10%) | 10(3.76%) | 0.047* |
Note: body fat mass percentage (FMP), * P <0.05,** P< 0.001
Body fat mass and FMP are components of body composition may be used for prognosticating GDM before done OGTT gestation,which have good sensitivity for risk screening.
4.Discussion
4.1 Changes in body composition during pregnancy
This study showed that normally the body composition including the body fat,total water and protein increase gradually during the whole pregnancy.Particularly,body fat mass and its percentage increase rapidly before 24 weeks of pregnancy,whereas increase in the GDM women is earlier and faster.A clinical study[17]evaluated the body composition of pregnant women found that the total body water and body fat gradually increased significantly compared in 12-14 weeks,20-18 weeks and 34-38w of gestation,which support to this study.The body fat mass increases linearly throughout pregnancy in women whose pre-pregnancy 18.5≤BMI<24.9 kg/m2,with an average increase of two kilogram every three months[18].The weight gain during pregnancy is mainly related to the increase of fat mass[19-21].Lederman et al[34]found that women with 19.8≤BMI<26 kg>2 and weight gain within the recommended range(11.5–16 kg)added about 4 kg of body fat during 14-37 weeks of gestation,that underweight or overweight women was 6.0kg and 2.8kg,respectively.The increase of fat free weight within the first and second pregnancy is 7-8 kg,which has no statistical difference among women with different pre pregnancy BMI[22].
In term to body composition changing from the first pregnancy to second pregnancy,FMP of women with GDM did not increase significantly(P=0.55),while the healthy pregnant women increased significantly(P=0.00091),suggesting that FMP of the GDM women was at a high level in the first pregnancyor even before pregnancy.A study[23]found that the fat mass of healthy pregnant women changed slightly in the early pregnancy and greatly raised in the third pregnancy,which is consistent with our study.
4.2 Relationship of FMP between the common and GDM women
In this study,FMP in the first pregnancy was statistically different between the common pregnant and GDM women(P=0.012)but arrived in the approximately same level in the third trimester(P=0.21).Some studies believe that rapidly increased fat mass during pregnancy makes the body in a high metabolic stress state and may be a possible risk factor result to GDM[24-25].Body composition analysis can be considered used to evaluate the risk of GDM in pregnant women before they done OGTT at 24-28 weeks of gestation.
4.3 Pre-pregnancy and prenatal BMI influence prediction in pregnant women
It should be noted that the pre-pregnancy in this study is not calculated by the weight before pregnancy and height,including calculated in the first trimester(n=605,60.74%)and second trimester,maybe its a limitation of this study though a study[26]found that body mass index(BMI)of fertile women was no significant difference between the first trimester(before 14 weeks gestation)and before pregnancy.
In low-weight pregnant women with pre-pregnancy BMI<18.5kg/m2,FMP was no significant difference between the control group and GDM group(P=0.28),implying that FMP has insufficient ability to predict the risk of GDM for them.FMP is not recommended as an evaluation index for the risk of GDM in low-weight pregnant women.A study of 97157 Japanese subjects showed that the probability of GDM occurrence increased with the high pre-pregnancy BMI[27].
Compared different prenatal BMI in GDM and common pregnant women,FMP was no significant difference between overweight andobese pregnant women.High FMP is common in prenatal overweight and obese pregnant women,but more common in GDM women compared with the control.This is consistent with Kawanabe's findings that obesity is an independent risk factor for diabetes mellitus[28].
4.4 Clinical application value of body composition analysis in evaluating the risk of GDM
This study found that pregnant women with body fat mass percentage(FMP)≥24.63%had a higher incidence of adverse pregnancy outcomes.All pregnant women,especially obese pregnant women,have received regular diabetes education,dietary guidance and weight management during pregnancy recruitment,which may have some influence on the results of body composition analysis in the second trimester.A prospective study with 2698 pregnant women suggested that FMP>25%could be a cut-off value used in evaluating risk level of gestational diabetes
[29].A multiethnic group study analyzed body composition in 728 pregnant women at 15 and 28 weeks’gestation showed that body weight and body fat mass were positively correlated with gestational diabetes occurrence,for overall gain weight increased by 0.21 kg/weeks increased 1.23 fold high risk in GDM occurrence[30],which is similar to this study.
This study found that age,FMP and high intracellular fluid were the high risk factors of GDM.Age is a independent risk factor for GDM[31-33]may because they often have decreased insulin sensitivity,abnormal lipid metabolism and impaired glucose tolerance[34-35].Overweight/obese women with age 35 years had 2.45 times higher risk of GDM and having excessive GWG at second trimester further increased the risk of GDM[36].A prospective cohort study of 154 GDM pregnant women and 981 healthy pregnant women found that body fat,muscle mass and extracellular fluid were positively correlated with gestational diabetes risk at 21~24 weeks of pregnancy,and body weight,muscle mass and intracellular fluid were negatively correlated with gestational diabetes risk[37].A prospective study in Japan found insulin resistance in GDM patients with low muscle/fat mass ratio calculated by body composition analysis[38].
5.Conclusion
Human body composition analysis can be a invasive,convenient method used to assess the risk of gestational diabetes mellitus(GDM)in pregnant women before done OGTT at 24-28 weeks of gestation,so as to do early intervention measures to prevent GDM occurrence,prevent maternal-fetal adverse outcomes and provide better more health care services.
Funding
The author declares no funding for this work.
Conflict of Interest
The author declare no conflict of interest.
Acknowledgment
I am grateful to Dr.Li Huaping for her be a tutor in my graduate state and give change for me to study on this topic.I also sincerely thank Feng Xiaohui and Caoyun assisted for data collection from department of nutrition in Shanghai Jiao Tong University Affiliated Sixth People’s Hospital
.Ou Honghui collected,calculated and analyzed the data,draw and proof the manuscript.
References
[1]Behnke AR Jr,Feen BG,Welham WC.The specific gravity of healthy men.Body weight pided by volume as an index of obesity.1942.Obes Res.1995 May;3(3):295-300.doi:10.1002/j.1550-8528.1995.tb00152.x.
[2]Wang ZM,Pierson RN Jr,Heymsfield SB.The five-level model:a new approach to organizing body-composition research.Am J Clin Nutr.1992 Jul;56(1):19-28.doi:10.1093/ajcn/56.1.19.
[3]Meihua Zhang,Munan Ma,Jinping Wang,et al.Effect of Gestational Diabetes Mellitus on the Growth,Development,and Stem Cells of Offspring[J]Maternal-Fetal Medicine,2021,03(0):E007-E007.DOI:10.1097/FM9.0000000000000130.
[4]Amrithraj AI,Kodali A,Nguyen L,Teo AKK,Chang CW,Karnani N,Ng KL,Gluckman PD,Chong YS,Stünkel W.Gestational Diabetes Alters Functions in Offspring's Umbilical Cord Cells With Implications for Cardiovascular Health.Endocrinology.2017 Jul 1;158(7):2102-2112.doi:10.1210/en.2016-1889.
[5]Lowe WL Jr,Scholtens DM,Kuang A,Linder B,Lawrence JM,Lebenthal Y,McCance D,Hamilton J,Nodzenski M,Talbot O,Brickman WJ,Clayton P,Ma RC,Tam WH,Dyer AR,Catalano PM,Lowe LP,Metzger BE;HAPO Follow-up Study Cooperative Research Group.Hyperglycemia and Adverse Pregnancy Outcome Follow-up Study(HAPO FUS):Maternal Gestational Diabetes Mellitus and Childhood Glucose Metabolism.Diabetes Care.2019 Mar;42(3):372-380.doi:10.2337/dc18-1646
[6]Liao S,Mei J,Song W,Liu Y,Tan YD,Chi S,Li P,Chen X,Deng S.The impact of the International Association of Diabetes and Pregnancy Study Groups(IADPSG)fasting glucose diagnostic criterion on the prevalence and outcomes of gestational diabetes mellitus in Han Chinese women.Diabet Med.2014 Mar;31(3):341-51.doi:10.1111/dme.12349.
[7]Zhu WW,Yang HX,Wang C,Su RN,Feng H,Kapur A.High Prevalence of Gestational Diabetes Mellitus in Beijing:Effect of Maternal Birth Weight and Other Risk Factors.Chin Med J(Engl).2017 May 5;130(9):1019-1025.doi:10.4103/0366-6999.204930.
[8]Simões T,Queirós A,Correia L,Rocha T,Dias E,Blickstein I.Gestational diabetes mellitus complicating twin pregnancies.J Perinat Med.2011 Jul;39(4):437-40.doi:10.1515/jpm.2011.048.
[9]Saito Y,Kobayashi S,Ikeda-Araki A,Ito S,Miyashita C,Kimura T,Hirata T,Tamakoshi A,Mayama M,Noshiro K,Nakagawa K,Umazume T,Chiba K,Kawaguchi S,Morikawa M,Cho K,Watari H,Ito Y,Saijo Y,Kishi R;Japan Environment and Children's Study(JECS)group.Association between pre-pregnancy body mass index and gestational weight gain and perinatal outcomes in pregnant women diagnosed with gestational diabetes mellitus:The Japan Environment and Children's Study.J Diabetes Investig.2021 Nov 30.doi:10.1111/jdi.13723.
[10]Cosson E,Cussac-Pillegand C,Benbara A,Pharisien I,Nguyen MT,Chiheb S,Valensi P,Carbillon L.Pregnancy adverse outcomes related to pregravid body mass index and gestational weight gain,according to the presence or not of gestational diabetes mellitus:A retrospective observational study.Diabetes Metab.2016 Feb;42(1):38-46.doi:10.1016/j.diabet.2015.06.001.
[11]Xu H,Ma Y,Zhang L,Liang Z,Chen D.Impact of pre-pregnancy body mass index,weight gain and blood lipid level during pregnancy on pregnancy outcome in patients with gestational diabetes mellitus.Zhejiang Da Xue Xue Bao Yi Xue Ban.2021 Jun 25;50(3):320-328.English.doi:10.3724/zdxbyxb-2021-0185.
[12]International Association of Diabetes and Pregnancy Study Groups Consensus Panel,Metzger BE,Gabbe SG,Persson B,Buchanan TA,Catalano PA,Damm P,Dyer AR,Leiva Ad,Hod M,Kitzmiler JL,Lowe LP,McIntyre HD,Oats JJ,Omori Y,Schmidt MI.International association of diabetes and pregnancy study groups recommendations on the diagnosis and classification of hyperglycemia in pregnancy.Diabetes Care.2010 Mar;33(3):676-82.doi:10.2337/dc09-1848.
[13]Coustan D R,Lowe L P,Metzger B E,et al.The HAPO Study:Paving The Way For New Diagnostic Criteria For GDM[J].American Journal of Obstetrics&Gynecology,2010,202(6):654.e1-654e6.doi:10.1016/j.ajog.2010.04.006
[14]Zhou BF;Cooperative Meta-Analysis Group of the Working Group on Obesity in China.Predictive values of body mass index and waist circumference for risk factors of certain related diseases in Chinese adults--study on optimal cut-off points of body mass index and waist circumference in Chinese adults.Biomed Environ Sci.2002 Mar;15(1):83-96.
[15]Chen Z,Du J,Shao L,Zheng L,Wu M,Ai M,Zhang Y.Prepregnancy body mass index,gestational weight gain,and pregnancy outcomes in China.Int J Gynaecol Obstet.2010 Apr;109(1):41-4.doi:10.1016/j.ijgo.2009.10.015.
[16]Yong HY,Mohd Shariff Z,Mohd Yusof BN,Rejali Z,Tee YYS,Bindels J,van der Beek EM.Independent and combined effects of age,body mass index and gestational weight gain on the risk of gestational diabetes mellitus.Sci Rep.2020 May 22;10(1):8486.doi:10.1038/s41598-020-65251-2.
[17]Piuri G,Ferrazzi E,Bulfoni C,Mastricci L,Di Martino D,Speciani AF.Longitudinal changes and correlations of bioimpedance and anthropometric measurements in pregnancy:Simple possible bed-side tools to assess pregnancy evolution.J Matern Fetal Neonatal Med.2017 Dec;30(23):2824-2830.doi:10.1080/14767058.2016.1265929.
[18]Butte NF,Ellis KJ,Wong WW,Hopkinson JM,Smith EO.Composition of gestational weight gain impacts maternal fat retention and infant birth weight.Am J Obstet Gynecol.2003 Nov;189(5):1423-32.doi:10.1067/s0002-9378(03)00596-9.
[19]Most J,Marlatt KL,Altazan AD,Redman LM.Advances in assessing body composition during pregnancy.Eur J Clin Nutr.2018 May;72(5):645-656.doi:10.1038/s41430-018-0152-8.
[20]Bosaeus M,Andersson-Hall U,Andersson L,Karlsson T,Ellegård L,Holmäng A.Body Composition During Pregnancy:Longitudinal Changes and Method Comparisons.Reprod Sci.2020 Jul;27(7):1477-1489.doi:10.1007/s43032-020-00141-6.
[21]PellonperäO,Vahlberg T,Mokkala K,Houttu N,Koivuniemi E,Tertti K,Rönnemaa T,Laitinen K.Weight gain and body composition during pregnancy:a randomised pilot trial with probiotics and/or fish oil.Br J Nutr.2021 Aug 28;126(4):541-551.doi:10.1017/S0007114520004407.
[22]Butte NF,Wong WW,Treuth MS,Ellis KJ,O'Brian Smith E.Energy requirements during pregnancy based on total energy expenditure and energy deposition.Am J Clin Nutr.2004 Jun;79(6):1078-87.doi:10.1093/ajcn/79.6.1078.
[23]Cowans NJ,Spencer K.The relationship between maternal body mass,smoking status and ethnicity and first trimester nuchal translucency thickness.Prenat Diagn.2011 May;31(5):446-9.doi:10.1002/pd.2713.
[24]Kawanabe S,Nagai Y,Nakamura Y,et al.Association of the muscle/fat mass ratio with insulin resistance in gestational diabetes mellitus.Endocr J.2019 Jan 28;66(1):75-80.
[25]Abreu LRS,Shirley MK,Castro NP,Euclydes VV,Bergamaschi DP,Luzia LA,Cruz AM,RondóPHC.Gestational diabetes mellitus,pre-pregnancy body mass index,and gestational weight gain as risk factors for increased fat mass in Brazilian newborns.PLoS One.2019 Aug 29;14(8):e0221971.doi:10.1371/journal.pone.0221971.
[26]Poston L.Gestational weight gain:influences on the long-term health of the child.Curr Opin Clin Nutr Metab Care.2012 May;15(3):252-7.doi:10.1097/MCO.0b013e3283527cf2.
[27]Enomoto K,Aoki S,Toma R,Fujiwara K,Sakamaki K,Hirahara F.Pregnancy Outcomes Based on Pre-Pregnancy Body Mass Index in Japanese Women.PLoS One.2016 Jun 9;11(6):e0157081.doi:10.1371/journal.pone.0157081.
[28]Devlieger R,Benhalima K,Damm P,Van Assche A,Mathieu C,Mahmood T,Dunne F,Bogaerts A.Maternal obesity in Europe:where do we stand and how to move forward?:A scientific paper commissioned by the European Board and College of Obstetrics and Gynaecology(EBCOG).Eur J Obstet Gynecol Reprod Biol.2016 Jun;201:203-8.doi:10.1016/j.ejogrb.2016.04.005.
[29]Wang Y,Luo BR.The association of body composition with the risk of gestational diabetes mellitus in Chinese pregnant women:A case-control study.Medicine(Baltimore).2019 Oct;98(42):e17576.doi:10.1097/MD.0000000000017576.
[30]Sommer C,Mørkrid K,Jenum AK,Sletner L,Mosdøl A,Birkeland KI.Weight gain,total fat gain and regional fat gain during pregnancy and the association with gestational diabetes:a population-based cohort study.Int J Obes(Lond).2014 Jan;38(1):76-81.doi:10.1038/ijo.
[31]Huang J,Chu X,Chen Y.Correlation and diagnostic value of maternal serum alpha-fetoprotein level,predelivery age and body mass with gestational diabetes mellitus.Gynecol Endocrinol.2021 Jan;37(1):83-87.doi:10.1080/09513590.2020.1751112.
[32]Li Y,Ren X,He L,Li J,Zhang S,Chen W.Maternal age and the risk of gestational diabetes mellitus:A systematic review and meta-analysis of over 120 million participants.Diabetes Res Clin Pract.2020 Apr;162:108044.doi:10.1016/j.diabres.2020.108044.
[33]Wang X,Zhang X,Zhou M,Juan J,Wang X.Association of Gestational Diabetes Mellitus with Adverse Pregnancy Outcomes and Its Interaction with Maternal Age in Chinese Urban Women.J Diabetes Res.2021 May 18;2021:5516937.doi:10.1155/2021/5516937.
[34]Lin PC,Hung CH,Chan TF,Lin KC,Hsu YY,Ya-Ling Tzeng.The risk factors for gestational diabetes mellitus:A retrospective study.Midwifery.2016 Nov;42:16-20.doi:10.1016/j.midw.2016.09.008.
[35]Cozzolino M,Serena C,Maggio L,Rambaldi MP,Simeone S,Mello G,Pasquini L,Di Tommaso M,Mecacci F.Analysis of the main risk factors for gestational diabetes diagnosed with International Association of Diabetes and Pregnancy Study Groups(IADPSG)criteria in multiple pregnancies.J Endocrinol Invest.2017 Sep;40(9):937-943.doi:10.1007/s40618-017-0646-6.
[36]Yong HY,Mohd Shariff Z,Mohd Yusof BN,Rejali Z,Tee YYS,Bindels J,van der Beek EM.Independent and combined effects of age,body mass index and gestational weight gain on the risk of gestational diabetes mellitus.Sci Rep.2020 May 22;10(1):8486.doi:10.1038/s41598-020-65251-2.
[37]Xu Q,Gao ZY,Li LM,Wang L,Zhang Q,Teng Y,Zhao X,Ge S,Jing HJ,Yang YT,Liu XJ,Lyu CJ,Mao L,Yu XM,Liu YH,Kong AJ,Yang XY,Liu Z,Zhang Y,Wang J,Zhang XS,Xue CY,Lu YP.The Association of Maternal Body Composition and Dietary Intake with the Risk of Gestational Diabetes Mellitus during the Second Trimester in a Cohort of Chinese Pregnant Women.Biomed Environ Sci.2016 Jan;29(1):1-11.doi:10.3967/bes2016.001.
[38]Kawanabe S,Nagai Y,Nakamura Y,Nishine A,Nakagawa T,Tanaka Y.Association of the muscle/fat mass ratio with insulin resistance in gestational diabetes mellitus.Endocr J.2019 Jan 28;66(1):75-80.doi:10.1507/endocrj.EJ18-0252.
Figures

Fig 1. Comparison and change of body fat mass percentage (FMP) in different pregnancy
Note: Con1: the controls in early pregnancy, Con2: the controls in middle pregnancy, Con3: the controls in middle-late pregnancy, GDM1: the GDM women in early pregnancy, GDM2: the GDM women in middle pregnancy, GDM3: the GDM women in middle-late pregnancy.
Fig 2.body fat mass percentage (FMP) of pregnant women in different pre-pregnancy BMI
Note. ConBMI1: the control group women with pre-pregnancy BMI <18.5 kg/m2, ConBMI2:the control group women with pre-pregnancy BMI 24-27.9 kg/m2, ConBMI3:the control group women with pre-pregnancy BMI I≥28 kg/m2, GDMBMI1:GDM pregnant women with pre-pregnancy BMI <18.5 kg/m2,GDMBMI2:GDM pregnant women with pre-pregnancy BMI 24-27.9 kg/m2, and GDMBMI3:GDM pregnant women with pre-pregnancy BMI ≥28 kg/m2.
Fig 3.body fat mass percentage (FMP) of pregnant women in different pre-delivery BMI
Note. ConBMI1: the control group women with pre-delivery BMI <18.5 kg/m2, ConBMI2:the control group women with pre-delivery BMI 24-27.9 kg/m2, ConBMI3:the control group women with pre-delivery BMI I≥28 kg/m2, GDMBMI1:GDM pregnant women with pre-delivery BMI <18.5 kg/m2,GDMBMI2:GDM pregnant women with pre-delivery BMI 24-27.9 kg/m2, and GDMBMI3:GDM pregnant women with pre-delivery BMI ≥28 kg/m2.
Fig 4.ROC curve of body fat mass in diagnose GDM
Fig 5.ROC curve of body fat mass percentage (FMP) in diagnose GDM
![]()

客服QQ:30444492琼网文【2021】1550-113号
增值电信业务经营许可证:琼B2-20210322
出版物经营许可证:新出发龙华出字第(2021)009号
广播电视节目制作经营许可证:(琼)字第00779号
版权所有 ©2002-2024 期刊网 琼ICP备2021005105号