Hong Kong Shue Yan University
Abstract
This study is aiming to investigated (a) the effect of price discount on price discount affect, internal reference price and perceived quality, (b) the effect of price discount affect, internal reference price and perceived quality on customer’s perceived value, (c) the effect of customer perceived value on customer’s purchase intention.
This study adopts quantitative analysis as a research method. A questionnaire is designed, and convenient sampling is the way we use to to collect data. Then we send questionnaire to 232 participants through Wechat and link on the internet. We analyze the data by using SPSS and PLS.
Price discount have the positive effect on purchase intention through price discount affect, perceived quality, internal reference price and perceive value. In the study, price discount with perceived quality and internal reference price have no relationship.
In the study, price discount have no significant with perceived quality and internal reference price in the actual life. Marketers can make a better price discount promote base on their self-conditions.
Keywords: price discount, perceived value, purchase intention
1.
Introduction
1.1 Background of the research
Fashion industry is a series of business activities about fashion goods and services. Clothes are the major product in fashion industry. Shoes, jewelry, cosmetics, hats, beauty salon, bags, glasses and decoration and household articles are also can be called fashion products. According to the Fashion Industry Economics (2017), fashion industry is the business organizations and their mutual relation on the market that design, produce, generalize, sell the product or service that are ahead of the time and beautifies people’s life based on people’s spiritual and cultural needs. Fashion products has two levels of value for customers -one is practical value and the other one is psychological value. Practical value means the pursuit to improve the convenience in life, and psychological value is the emotional pursuit to improve self-evaluation.
In the past two decades, fashion industry has seen a prominent development. Franks (2000) considered that perception and response are the key strategy to keep the profit status in the fashion market. Today’s fashion industry is highly competitive and keep refreshing the products. Fashion products have a short life cycle, offer a wide range of options, and show fluctuating and unpredictable demand. Because of these features, brands/marketers always make some promotion to attract customers and increase profits.
From Antonio Achille, Achim Berg, Luan Lan and Daniel Zipser’s (2017) research, luxury brand store mainly located in first and second-tier cities in China at present, but the consumption of luxury products in third-tier or below cities were growing rapidly. In entry luxury brand market, the sales growth is predicting to achieve 11%~13% in the next five years, and growth to 620 billion yuan till 2025. More young customers are willing to accept and purchase entery luxury brand, they accounted for 18%~20% of luxury products consumption, especially the generation after 90s. Entry luxury brand store developed towards to second and third-tier cities and open the online shop in e-commerce platform like Tianmao. In jewelry market, wedding jewelry accounted for 40% in the jewelry consumption, and fashion jewelry growth can expect to achieve 10%~12%. In China, fashion industry presents an increasing trend, so China is the market which is full of competitiveness and opportunities in fashion industry. Chinese customers have strong spending power, so it is important that the brands use some promotion to attract customers, especially the entry luxury brands. Entry luxury product (eg, Furla, Sandro, Maje, etc) gives customers a higher social status on psychology than common products and the price is cheaper than the luxury products (eg, Chanel, Gucci, Dior, etc), so it is a better choice for young customers.
Price discount is a popular and useful promotion way, as it provides the extra value to attract customer, and encourages customers to purchase the promotion product in a short time. (Yin and Huang 2014). According to some publications, brands attract customers through price promotion and hope to keep margins, and they are existing contradiction. In addition, price discount may bring more customers to the brand, but such discount may have negative effects on internal reference price and perceived quality. Product features and the price are the two major decision variables that marketers used to affect the evaluation and customer’s purchase decision and behavior. To become more effectively, marketers should understand how customers use the price information in the evaluation. If customers use price as the standard to evaluate the quality, whether it will be offset by the negative influence of price on perceived value in terms of purchase intention remains unknown. Will the low price decrease the perceived quality and have a negative impact on product value, or will it result in a strong perceived value? Find the relationship between price discount and purchase intention, marketers can translate the promotion into purchase intention and increase the profit. In the previous researches from Sawyer and Dickso (1984); Zeithaml (1988), perceived quality and perceived value have positive relationship and perceived price and perceived value have negative relationship. Further, perceived value is the key variable. Higher perceived value can expect higher purchase intention (Dodds and Monroe 1985; Monroe and Chapman 1987) and purchase behavior (Zeithaml 1988).
Today, we can see the price discount promotion as a commonly used method, especially the fast fashion brands like Zara, and H&M. They refresh their products and will keep a large inventory which increase the cost, so they have price discount every day. But whether these price discounts really help to attract customers and increase their purchase intention remains debatable. That is what the study wants to find out.
Fashion products not only satisfied people’s basic needs in daily life, but also show people’s status and attitude through dressing. China has a large population and more teenagers pay attention to daily fashion. Today’s fashion industry in China is characterized by keen competition. There are local brands, and luxury brands for different price range customers. Fashion products are fast updated and have various styles. Brands and retailers always give price discount for promotion. The study focusses on Chinese customers, and does not prescribe a limit to price range, product type and appointed brand of fashion products. The study researches the relationship between price discount and customer purchase intention.
1.2 Research purpose
The price discount can increase the turnover in the short time, but it is uncertain whether price discount has a positive relationship with customer purchase intention. The previous literature hasn’t proved their relationship directly. This research investigated (a) the effect of price discount on internal reference price and perceived quality, (b) the effect of price discount affect, internal reference price and perceived quality on customer’s perceived value, (c) the effect of customer perceived value on customer’s purchase intention.
1.3 Research question
This study is proposed to examine the effect of price discount on customers’ purchase intention in fashion industry in China.
1.4 Importance of the study
In the study, there are six constructs: price discount, price discount affect, perceived quality, internal reference price, perceived value and purchase intention. Some constructs keep a positive relationship with each other, but some may turn to a negative relationship under different situation and environment. Marketers can use the study result to compare with their own structure, adjust their price discount promotion strategy, and try to make the price discount more effective to really increase customer purchase intention and help the long-term development.
1.5 Organization of the study
In the study, there are six chapters. Chapter 2 will have some literature reviews about the items and constructs. Chapter 3 will show the research model and nine hypotheses of the research. Chapter 4 will explain the research method, measurement model and participants, and will do a simple analysis of pilot test. Chapter 5 will do some detail data analysis of descriptive statistics, measurement model and structural model of using SPSS and SmartPLS software, and then give the result of the model and hypotheses. Chapter 6 will make some discussion, introduce the implication of the study, show the limitation, give some suggestions for future study, and the last, and make a conclusion.
1.6 Research gap
Previous researchers have found that the price discount and purchase intention have a positive relationship through internal reference price, perceived quality, brand image, perceived value (Grewal et al. 1998). In Lee and Chen-Yu’s study (2018), the price discount affects also affect purchase intention. In this study, we propose to examine the effects of price discount on purchase intention via internal reference price, perceived quality, brand image, perceived value and price discount affects. There are fewer studies have research the relationship between price discount affect and perceived value, internal reference price and perceived value.
The previous studies are all studied about the fashion industry in UK or other countries, there are less studies in China. The research in fashion industry in China are more focus on the supply chain.
To fill these gaps, this study will do the research about the effect of price discount to purchase intention through price discount, price discount affect, perceived quality and perceived value of fashion industry in China.
2.Literature Review
2.1 Price discount
Earlier, some researchers (Grewal et al. 1996) presented a customer information processing inverted U explanation of customer’s response of price promotion (Gotlieb & Swan, 1990; Ozanne, Brucks, & Grewal, 1992). Grewal et al. (1996) also predicted that when the low-price discount occurs, customers are unlikely to process information because the price promotion has little monetary value. Likewise, when the high-price discount occurs, customers are unlikely to process information because of the uncertainty of the benefits. However, when the discount level is moderate, there is greater uncertainty of the deal, so customers need to process the information more carefully and thoughtfully. In marketing, the promotion representation is “4P”: product, price, place and promotion. Price is an important factor that affected customers purchase behavior. Customers’ response to price discount depends on the benefit and value that price provide to them (Keller, 1998). Most research of price promotions effects was focused on store coupons and price reduction or price discount on the goods package and manufacturer. Many literatures show the short-term price discount (promotion) would have a dramatic and immediate influence on sales result (Blattberg and Neslin, 1989; Gupta, 1988; Totten and Bloch, 1987). In marketing, brands love to give coupons or give percentage discounts to attract customers. Customers can easily and directly know that they can purchase the discount product at a lower price. For example, customers will pay more attention to the discount product in supermarket.
Some traditional research shows that customers should be interested in price discount when the saving money is more than the searching cost (Stigler, 1987). However, other studies have a more complicated suggestion (Darke, Freedman & Chaiken, 1995, Tversky and Kahneman, 1981). Customers are interested in price discount because they can buy the product that is cheaper, no matter how much money they save. They found that customers will try to get a larger percentage discount even the saving money is five dollars, 33% discount is more attractive than 4% discount (Darke & Freedman, 1993; Heath, Chatterjee & France, 1995). The five dollars is more substantial when it has a larger percentage discount of the original price. However, another reason may be something more than the economic benefits. Tversky and Kahneman (1981) said that people will feel happier when they save five dollars when the original price is 15 dollars than a larger price. Thaler (1985) found that customers gain benefits not only because they exchange things but also because they realize perceived value in the deal. Customers have a standard of judging the fairness of price from different aspects. For example, customers may estimate the fair price based on their perception of the product/service cost (Kahneman, Knetsch & Thaler, 1986) or the past information of a similar product/service. More importantly, some research (Litchenstein & Bearden, 1090; Urbany, Bearden & Weibaker, 1988) indicated that the price discount would increase the estimates of fair price and normal price and increase the perceived value in the transaction and reduce the searching price. When customers set the same price as the discount price, they will feel more satisfaction.
Previous studies have shown that the price discount would change customers purchase decision, so retailers use price discount more frequently to increase sales profits (Inman and McAlister, 1993). Today’s marketers have some different ways to launch their price promotion to customers and attract them effectively (Della Bitta, Monroe and McGinnis, 1981), such as coupons for some dollars and percentage discount. Marketers can provide price discount for all customers or only for those who get the coupon. In the situation of using coupons, marketers can provide them to all customers or just send the coupons to a sub-group of potential customers.
2.2 Price discount affect
In previous studies, there are three kinds of price discount influence. Economic effects of price discount, information effects of price discount and affective effects of price discount (Jung Eun Lee* and Jessie H. Chen‑Yu, 2018).
According to Zeithaml (1988), when customer cannot evaluate the product quality, they would rely more on extrinsic product attributes (like price, brand and advertising performance) instead of intrinsic product attributes (like color and textures) in perceived quality. If customers find it hard to predict the service quality at the beginning, they would expect the service quality to match the paid price (Garretson and Clow 1999). A high price discount means that customers might get a low-quality service. In addition, if customers can anticipate the quality of product, they would be happy to get the price discount and give a positive evaluation. The price discount as a reduction of the original price, has a positive effect on perceived quality.
Affect always describes emotion and mood in marketing research. Especially, the affective effect of price discounts is the feeling and emotions when customers receive a promotion or miss it (Raghubir et al. 2004). In current study, affective effect of price discount can be defined as the feeling which is caused by price discount. This affective effect can be positive and negative. Raghubir et al.’s (2004) research revealed that, customers would feel regret when they miss a deal, and they would feel jealous when they knew only some special customers can use special discount. Price discount (promotion) would increase customer positive affect (like happiness) (Honea and Dahl (2005) and Peine et al. (2009), and Schindler (1998) researched that price discount (promotion) can make customers excited. According to these researches, price discount can increase customers’ positive affective effect.
2.3 Perceived quality
Holbrock and Corfman (1981) thought quality is a relatively global value judgment. Quality is the active relationship between customer and supplier (Eriksson et al., 1999). Klaus (1985) advocated the integrative approach, in which service quality can be understood as the value to customers. These factors would affect the perceived quality of customers: (a) price, (b) characters of the product (taste, size, style, etc.), (c) brand and manufacture, (d) package, (e) word-of-mouth, (f) advertising, (g) shopping experience. The more important attribute the product has, the higher information value it provides to customers, and the important attribute would have greater influence on perceived quality. Enis and Stafford (1969) suggested that if the price is the only information that customers know about the product, they would judge the product or service quality based on the price. If the price is higher than similar product or service in the market, they would expect more for the higher quality. Gonsior (1964) indicated that the price was the determiner of perspective of quality with the same other conditions. In McConnell’s (1968) research, he found that the product quality of high-priced brand was better than that of medium-priced brand, but the perceived quality was not different between medium-priced brand and low-priced brand. Both Scitovsky (1967) and Shapiro (1968) have hypothesized that customers who tend to use price to form impressions of product quality were more familiar with the product. A large amount of literatures describes the relationship of price-perceived quality, though there were some differences in the findings. Some researchers like Dodds and Monroe (1985); Some past research shows that the effect of price on perceived quality may vary inversely with other available information value (Chang and Wildt 1989). If it is a piece of low value information, customers will tend to judge the perceived quality by the price. On the other hand, if there is a piece of high value information, the perceived quality will be more influenced by the non-price information, so customers will rely less on the price to perceive quality.
2.4 Internal reference price
Term reference price means the way customers use price information in the store environment. If customers use the price information based on the purchasing experience in the past, they use the memory-based reference price (MBR) mechanism (Briesch et al. 1997). Though there are some price setting rules of memory-based reference price, the researchers assume that customers will compare each brand price to a similar brand reference price (Winer, 1986; Lattin and Bucklin, 1989; Erdem et al. 2001). Memory-based reference price mechanism will cause customers to make purchase decisions relying on the past purchase experience, so the price over times is an important problem to marketers. On the contrary, customers can compare a brand’s price to the reference price by the current distribute of the price in the store. In such situation, customers use stimulus-based reference price (SBR) mechanism (Briesch et al. 1997). Mayhew and Winer (1992) deemed that the price of stimulus-based reference price is the information resulting from the marketing. If customers follow the stimulus-based reference price mechanism, price response will be affected by the reasonable or fair level of the price. On account of stimulus-based reference price mechanism, if the new price is higher than customers’ reference price, customers will have no response to the price reduction.
Customer judgment depends on the interpretation of the information. Therefore, there is an acceptance range for price assessment. The price in the acceptance range is assimilated and believable. Thus, in the acceptable price range, discount may lead to a lower internal reference price. The consistent price discount promotion will have two after effects-one is that customers will feel more cost-efficient of earlier price discount than later price discount; the other one is when the current price turns back to the original price, customers will feel it is a price increase. To compare with the reference price, the perception of future price also may affect customers’ response to discount promotion.
In the previous research, reference price’s positive effect, was mainly due to the shift in the customer’s internal price standard, no matter it was plausible or exaggerated, and might be affected by contextual cues (like distinctiveness and consistency of price advertising, store type and brand name) (Berkowitz and Walton, 1980; Biswas and Blair, 1991; Blair and Landon, 1981; Della Bitta et al., 1981; Fry and McDougall, 1974; Lichtenstein and Bearden, 1989; Urbany et al., 1988). Diamond and Campbell (1989), Kalwani and Yim (1992), Gedenk and Neslin (1999) found the long-term risk and negative effects of such promotions. Some studies proved that customer will make a quality-price inferences (Zeithaml, 1988 and Lichtenstein et al., 1988), and when the price becomes the only information that customers get from the product, they will make a connection with promotion brand and low quality (Hun and Keaveney, 1994). If the promotion itself can justify the purchase, customers will not buy for the brand but for some promotions (Gedenk and Neslin (1999).
2.5 Perceived value
Utility theory is the basic of modern microeconomic theory, and it provides the theoretical underpinning for the value concept (Lanchester, 1971, in Caruana et al, 2000). This emphasizes that customers always buy product/services not for the benefits. They buy lots of attributes. Attributes come from the attributes combination’s effectiveness minus the sacrifices when they are obtaining the product. In other words, value conceptualizes as the net trade-off that customers perceive. Perceived value has two basic conceptions. Firstly, customer perceived value is the result of expectation/purchase perception, the evaluation of transaction and post-purchase/after-use. The benefits including the expected value such as product quality (Monroe, 1990). Sacrifices including monetary (price) and non-monetary considerations such as time and efforts in the case of purchase (Cronin, et al., 2000; Dodds, Monroe, & Grewal, 1991; Monroe, 1990). Perceived value occurs at the whole stages of the purchase process, especially the prepurchase stage (Woodruff, 1997). Thus, perceptions of value can exist without the experience of purchasing the product or service. Thus, different components of perceived value weight differently on customers’ mind. Previous research shows that value is an evaluation that balances the customers’ gain and loss in the exchange versus (Dodds, Monroe, and Grewal, 1991; Zeithaml, 1988). Therefore, the basic components of perceived value are price promotion and perceptions of brand quality. Blattberg and Neslin (1990) found that, reference price will encourage customers to save money when a discount occurs. To customers, product value is a comparison between tangible and intangible benefits from the total cost and usage of product (Nilson, 1992). When customer gain benefit from the product greater than the expected long-term cost, the product is creating value for customers (Slater and Narver, 2000).
2.6 Purchase intention
Intention is the behavior that a person try to achieve his/her desired future goals, and it also refers to whether a customer decide his/her behavior in the decision process. Perceived value can be an independent condition of participation in a deal. Purchase intention is formed under the assumption of a deal, so the purchase intention is considered as an important indicator in the actual purchase. In common sense, if a product’s low perceived value caused the high price or low product quality, the customer purchase intention will be low; but if the product is judged high in perceived value, the purchase intention will improve. Then, customers will have the intention to purchase certain products according to the order. The expected family income expected price and expected benefits are the three main factors to form by the customer purchase intention. However, there are some other external factors to affect customers’ purchase decision and behavior. Brands and organizations cannot decide whether the customer purchase behavior is totally based on customer purchase intention. The past research found that purchase intention has a positive influence on perceived value (Dodds, Monroe, and Grewal, 1991; Grewal, Monroe, and Krishnan, 1998), and they also found that the positive store image can lead a higher customer purchase intention.
High customer purchase intention is the best way to predict the possibility of customers’ future behavior (Molinari, Abratt, & Dion, 2008).Value perceptions may take shape of independent participation in a transaction, and purchase intention is formed under the hypothesis of a deal to be decided, so it is an important standard in an actual purchase. Once the factors that affect customer purchase intention are certain, the marketing strategy can be adjusted and improved to produce new projects that attract customers and benefits for them and stimulate business growth (Cretu & Brodie, 2007). A better service can lead to a positive behavioral intention, and then increase the frequency of going to the store and customer purchase intention (Carrillat et al. 2009; Cronin and Taylor, 1992; Fornell, 1992; Szymanski and Henard, 2001; Zeithaml et al. 1996). Customers will avoid risks. It means that when they perceive risk that affects their purchase decision, customers will decrease purchase intention (Bauer, 1960). When perceived risk is low, customer purchase intention will increase. For customers, they prefer to buy some brands they bought before rather than buy new brands, because they have higher perceived risks of new brands, and it will lower their price consciousness and decrease their purchase intention (Tseng and Hwang, 2003).
Customer purchase intention will be affected by the personal reason. Landon (1974) found that customer’s actual self-image, ideal self-image and purchase intention also have relationship. In the actual transaction, customer purchase intention can be adjusted by self-consistency motivation and self-enhancement motivation.
3.Conceptual Framework
3.1 Research model
To research the relationship between price discount and purchase intention, the study uses four items to connect them: price discount affect, perceived quality, internal reference price and quality value.
From previous research, customers use price as a standard or a nansis to predict the quality of product, because they believed that the forces of marketing competitive supply and demand will determine the market price. Price discount promotion may reduce the product perceived quality when every customer can get the discount. In addition, when retailers reduce the price of the promotion product in price discount, they may cause customers to reduce the product internal reference price. In the study, we will survey the positive relationship between price discount and perceived quality and internal reference price.
There are many factors affect price discount affect, and the affective can be positive and negative. To know the price discount would do some psychological efforts for customers, that they will make it into the purchase behavior. Price discount is normal in the Chinese market, so in this study, we will survey that whether customers can feel positive or negative feeling with the price discount promotion. The lack of research of the relationship between price discount affect and perceived value, the study will do some survey to fill it.
Olshavsky (1985) and Rowley (1998) regarded quality as an evaluation of product. The study will survey this relationship is work in fashion industry in China. When the price discount directly affects the perceived quality, customers would perceive the higher discount as lower quality. Price discount will affect the perceived quality, but it is depending on different customers and product categories. Zeithaml (1988) suggested that the relationship between them is mediated by perceived price, and Jacoby and Olson (1977) pointed out that customer form the perceived value based on the actual price, and then the perceived value would affect the formation of perceived quality. In the study, we will survey the relationship between price discount and perceived quality in fashion indusctry in China.
Internal reference price is based on information in the environment and product experiences (Zeithmal and Graham, 1983), and the price discount is one of the inputs of internal reference price. There are fewer previous studies have research of the relationship between internal refernce price and perceived value. This study will assume thaey are positive relationship and to prove when the internal reference price becomes higher, the perceived value will go higher.
Perceived value means the net trade-off that customers gain from the benefits, sacrifices and cost from products, services or suppliers. Purchase intention means that customers select the brands in the portfolio in the evaluation period and form the priority order. Therefore, purchase intention and perceived value are measures of separate constructs, and they are expected in a positive relationship with each other in most cases. This research is fits for this study and the study can test the positive relationship between perceived value and purchase intention.
This is the model of this research:
Figure 3.1. Research Model
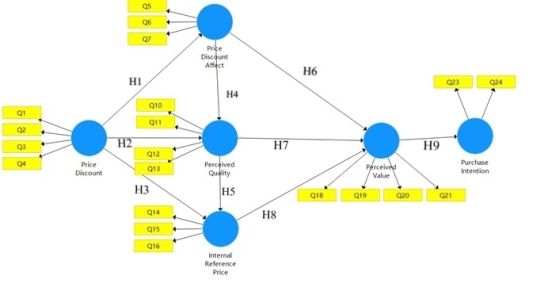
3.2 Research hypothesis
There are totally nine hypothesizes in this study:
Hypothesis 1 Price discount has a positive effect on price discount affect.
Hypothesis 2 Price discount has a positive effect on perceived quality.
Hypothesis 3 Price discount has a positive effect on internal reference price.
Hypothesis 4 Price discount affect has a positive effect on perceived quality.
Hypothesis 5 Perceived quality has a positive effect on internal reference price.
Hypothesis 6 Price discount affect has a positive effect on perceived value.
Hypothesis 7 Perceived quality has a positive effect on perceived value.
Hypothesis 8 Internal reference price has a positive effect on perceived value.
Hypothesis 9 Perceived value has a positive effect on purchase intention.
4.Research Method
4.1 Research design and measurement
The study uses a quantitative way to research. The study is not for building a new theory or a new construct. Compared with experiment, survey saves more money, time and energy. Questionnaire survey is easier to quantify. The sequence of questions and the answers are all fixed, so it is helpful to quantify. The result of questionnaire survey is easier to analyze statistically by software. Questionnaire survey is more convenient to survey participants’ attitude, thoughts, choices and behavior in a large scale. The study devote to examine the correlation between price discount and customer purchase intention.
A questionnaire is designed to measure the model and hypothesis. There are twenty-four questions in the questionnaire, and five personal information questions. The study uses close-end questions, and the questionnaire will give the answer list for participants to choose their answer. There is no need to answer with their own words.
The price discount questionnaire items based on Chao and Liao’s (2016) questionnaire design. The price discount affect’s questionnaire items were based on Lee and Chen-Yu’s (2018) designed questionnaire. Four items of perceived quality and three items of purchase intention were measured by Sweeney et al. (1999). Perceived value’s five items were measured from Urbany et al. (1988). The internal reference price’s questionnaire items were from Grewal, Krishnan, Baker & Borin (1998). All questions have been adjusted for the purpose of study.
The questions will be measure by the 7-point bipolar scale (Mehrabian and Russell 1974) (1 = very low/disagree, 7 = very high/agree), this scale is used by a lot of researchers.
4.2 Participants
The questionnaire was sent to participants in June. 2019. The study uses convenient sampling method that is self-administered and has 232 participants to finish the questionnaire. After eliminating invalid questionnaires, we keep 200 questionnaires. Participants who have the ability and experience to make the purchase decision by themselves of fashion products. This kind of participants should meet some price discounts in their purchasing. All the participants live in China because the study focus on fashion industry in China market. The personal information will collect their gender, age, education level, income per month and the money allocated in each month.
4.3 Pilot test
The study used SPSS software to evaluate the data. Factor analysis, reliability test, correlations, means and standard deviation are used to finish the pilot test. The other software is SmartPLS.
Pilot test is collected from fifty participants’ questionnaires. The reliability of constructs is tested by the Cronbach's Alpha. The Cronbach's Alpha is 0.976, and the value is greater than 0.7, so this sample has the great reliability.
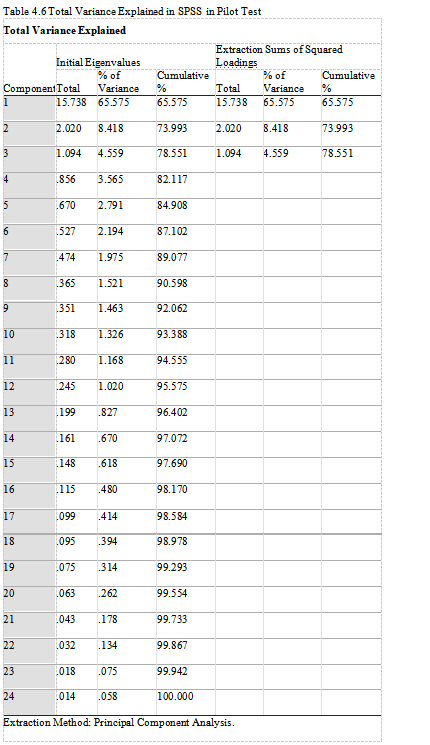
Table 4.2 shows Kaiser-Meyer-Olkin Measure of Sampling Adequacy is 0.868, p<0.001, has the statistically significant, and the value is greater than 0.8, this sample is suitable for factor analysis.
Table 4.2 KMO and Bartlett’s Test in SPSS in Pilot Test

In Table 4.3, the mean of price discount, price discount affect, perceived quality, internal reference price, perceived value and purchase intention are 5.46, 5.58, 5.04, 4.77, 5.49, 5.71, respectively. The standard deviation of price discount, price discount affect, perceived quality, internal reference price, perceived value and purchase intention are 1.26, 1.14, 1.18, 1.41, 1.19, 1.15,
Table 4.3 Descriptive Statistics in SPSS in Pilot Test

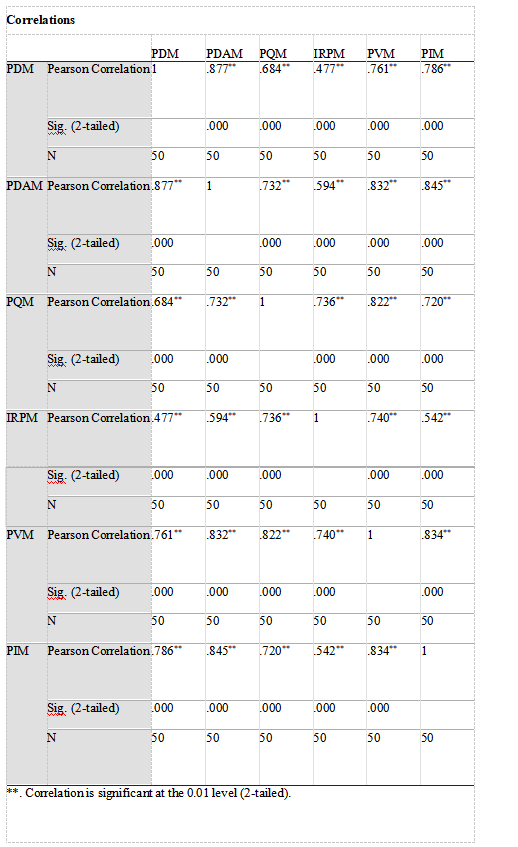
Table 4.4 shows the correlation between each construct. The correlation between PDM and PDAM is 0.877, and p<0.001. There is a positive correlation between two groups. The correlation between PDM and PQM is 0.684, and p<0.001. There is a positive correlation between two groups. The correlation between PDM and IRPM is 0.477, and p<0.001. There is a positive correlation between two groups. The correlation between PDAM and PQM is 0.732, and p<0.001. There is a positive correlation between two groups. The correlation between PDAM and PVM is 0.832, and p<0.001. There is a positive correlation between two groups. The correlation between PQM and IRPM is 0.736, and p<0.001. There is a positive correlation between two groups. The correlation between PQM and PVM is 0.822, and p<0.001. There is a positive correlation between two groups. The correlation between IRPM and PVM is 0.740, and p<0.001. There is a positive correlation between two groups. The correlation between PVM and PIM is 0.834, and p<0.001. There is a positive correlation between two groups.
Table 4.4 Correlations in SPSS in Pilot Test

Through the value of the load factor, the difference between the main indicators reflected by different common factors can be analyzed. Just like component 1, it has the large load factor on most indicators; and component 2, it has the large load factor on the PD1, PD3, PDA1, IRP1, IRP2, IRP3. component 3, it has the large load factor on the PDA4, IRP2, so component 1 responses the comprehensive indicators, and the actual meaning of other components is not obvious.
Table 4.7 Component Matrix in SPSS in Pilot Test

Test the construct reliability use the cronbach's Alpha. the Cronbach's Alpha is 0.976, and the value is greater than 0.7, this sample has the great reliability. (Table 4.8)
Table 4.8 Reliability Statistics in SPSS in Pilot Test

In Statistic of Skewness, most of them have the absolute value that <1, only PI2 and PI3 e1. West et al. (1996) proposed a reference of substantial departure from normality as an absolute value of skewness is >2. So in the pilot test, the absolue value even >1 it is also work. (Table 4.9)
Table 4.9 Descriptive Statistics in SPSS in Pilot Test

5.Results
5.1 Descriptive statistics
From the data, there are 46.5% of female and 53.5% of male. There are six different age groups and most of participants are between the age of 20-30 (29.5%) and 40-50 (32.0%). The education level group “junior college and undergraduate” had the largest number of participants, accounting for 75.5%. For the income, there are 24.5% of participants has 5,001-8,000 income per month, and group “8,001-10,000”, “10,001-20,000” also has a large proportion (19.0% and 20.5%). 30.0% of participants’ money allocated in each month are 5,001-10,000 and 29.5% are 2.501-5,000. (Table 5.1)
Table 5.1 Participants’ general specifications in SPSS


5.2 Measurement Model
The study keeps 200 samples to do the data analysis.
Table 5.2. Case Processing Summary in SPSS

Kaiser-Meyer-Olkin Measure of Sampling Adequacy is 0.926, p<0.001, has the statistical significant, and the value is greater than 0.9, this sample is very suitable for factor analysis. The result of KMO is better than pilot test is the sample size is bigger than pilot test, so the result will better. (Table 5.3)
Table 5.3 KMO and Bartlett’s Test in SPSS

The Cronbach's Alpha is 0.946, and the value is greater than 0.7, this sample has the great reliability.
Table 5.4 Reliability Statistics in SPSS

When the study ran the data in factor analysis, in the table of rotated component matrix. In Table 15, question no.8 and no.9 cannot make a route with question no5, no.6 and no.7, so we delete both no.8 (PDA4) and no.9 (PDA5). Then we found that the question no.22 also have some problem so we delete it.


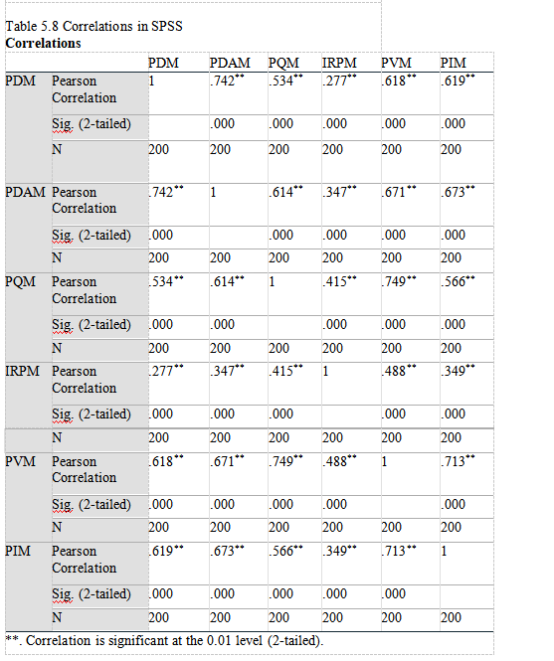
In Table 5.8, it shows the correlation between each construct. The correlation between PDM and PDAM is 0.742, and p<0.001. There is a positive correlation between two groups. The correlation between PDM and PQM is 0.534, and p<0.001. There is a positive correlation between two groups. The correlation between PDM and IRPM is 0.277, and p<0.001. There is a positive correlation between two groups. The correlation between PDAM and PQM is 0.614, and p<0.001. There is a positive correlation between two groups. The correlation between PDAM and PVM is 0.671, and p<0.001. There is a positive correlation between two groups. The correlation between PQM and IRPM is 0.415, and p<0.001. There is a positive correlation between two groups. The correlation between PQM and PVM is 0.749, and p<0.001. There is a positive correlation between two groups. The correlation between IRPM and PVM is 0.488, and p<0.001. There is a positive correlation between two groups. The correlation between PVM and PIM is 0.713, and p<0.001. There is a positive correlation between two groups.

Table 5.10 provides an example from different data to compare every item to the its’ intended constructs. The item loading is higher than cross loading when see going down a construct in a column. Each item loads highest on its’ own construct.
Table 5.10 Cross Loading in SmartPLS

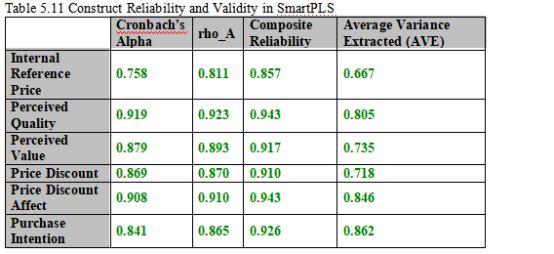
In Table 5.11, test the construct reliability use the Cronbach's Alpha, rho_A and composite reliability(CR).The Cronbach's Alpha of the six items are 0.758, 0.919, 0.879, 0.869, 0.908, 0.841, respectively. The rho_A of the six items are 0.811, 0.923, 0.893, 0.870, 0.910, 0.865, respectively. The composite reliability of the six items are 0.857, 0.943, 0.917, 0.910, 0.943, 0.926, respectively. The value is greater than 0.7, the agreement between the items is good, so, the agreement between the six items (internal reference price, perceived quality, perceived value, price discount, price discount affect, purchase intention) is good.
Test the validity use average variance extracted (AVE). The AVE of the six items are 0.667, 0.805, 0.735, 0.718, 0.846, 0.862, respectively. When the AVE value is greater than 0.50, it indicates that the items has better convergence validity. So, the six items (internal reference price, perceived quality, perceived value, price discount, price discount affect, purchase intention) have better convergence validity.
In Table 5.12, the red number indicates the square root of the average variance extracted (AVE), and the black number indicates the correlation coefficient between the variables. If the AVE arithmetic square root is greater than the absolute value of the correlation coefficient between the variables, it means that the internal correlation is greater than the external correlation, indicating that there is a difference between the latent variables, then the discriminant validity is high. We can find that the red numbers are greater than the black numbers, indicating that the discriminant validity of the measurement model is satisfactory.

5.3 Structural model
R-squared indicates the proportionate amount of variation in the response variable y explained by the independent variables X in the linear regression model. In this case, the R-squared of the independent variables X (internal reference price, perceived quality, perceived value, price discount affect, purchase intention) are 0.207, 0.399, 0.644, 0.554, 0.509, respectively. The Adjusted R-Squared are 0.199, 0.393, 0.639, 0.551, 0.506, respectively. Five model (internal reference price, perceived quality, perceived value, price discount affect, purchase intention) explains about 20%, 40%, 64%, 55%, 51% of the variability in the response variable (Y), respectively. (Table 22)

![C:\Users\DORA\Documents\Tencent Files\578124730\Image\C2C\E_{(R5H]ZY4O}49`H55ECO6.png](/convert/2022-07-28/file_165899797252101505.024.png)
Figure 5.1. R-Squre in Algorithm
In table 5.14, the mean of the differences between price discount and internal reference price is 0.078, and the standard deviation of the differences is 0.088, the test statistic is t=0.925, p=0.355, p >0.05, we should not reject the null hypothesis H3. There is no significant difference between price discount and internal reference price.
The mean of the differences between price discount and perceived quality is 0.190, and the standard deviation of the differences is 0.102, the test statistic is t=1.752, p=0.080, p >0.05, we should not reject the null hypothesis H2. There is no significant difference between price discount and perceived quality.
The P-value of price discount to internal reference price is 0.355, and the P-value of price discount to perceived quality is 0.080, so we reject both two hypothesizes.
Table 5.14 Mean, STDEV, T-values, P-values in SmartPLS


Figure 5.2 Statistics in Bootstrapping

6.Discussion and conclusions
6.1Discussion
From the previous learning and data analysis, the study proves the relationship between price discount and customer purchase intention. We supported H1 (price discount has a positive effect on price discount affect), H4 (Price discount affect has a positive effect on perceived quality), H5 (Perceived quality has a positive effect on internal reference price), H6 (Price discount affect has a positive effect on perceived value), H7 (Perceived quality has a positive effect on perceived value), H8 (Internal reference price has a positive effect on perceived value), H9 (Perceived value has a positive effect on purchase intention), and rejected H2 (Price discount has a positive effect on perceived quality) and H3(Price discount has a positive effect on internal reference price). In the study, the model still works.
6.2 Research implications
The study can help the marketers to use the right promotion way to attract customers. Price discount is a good promotion way but if a brand always uses it and keeps the discount for the long-term, it will have a negative effect on themselves. Price discount promotion can be based on target customers, price range, and fashion product categories.
6.3 Limitations and suggestions for future research
The first limitation is that the study uses convenient sampling, so the participants were not evenly distributed across all provinces in China. Most of the participants live in the south of China, especially Guangdong Province.
The second limitation is that the research time is short, so there is a lack of time to collect more questionnaires from participants. Only 200 valid samples are collected; this sample size is small.
The third limitation is that the questions of income per month and the money allocated in each month lack consideration about such factors as prices and wages affected by the difference in social environment between mainland and Hong Kong.
This study suggestes a deeper research into the relationship between price discount, internal reference price and perceived value. For fashion industry in China, the way to promote price discount can attract customers and gain their recognition.
6.4 Conclusions
The study surveys customers’ attitude towards price discount and purchase intention. Price discount does work and brings market profits to marketers, but when marketers decide to offer price discount, they should consider their target customers and barnd positioning. Price discount has a positive relationship with price discount affect, and price discount affect, perceived quality and internal reference price will impact on perceived value. When customers’ perceived value becomes higher, the purchase intention will increase.
Reference
Antonio Achille, Achim Berg, Luan Lan and Daniel Zipser (2017). Look at
global fashion and the Chinese market.
Huang, H. C., Chang, Y. T., Yeh, C. Y., & Liao, C. W. (2014). Promote the
price promotion: The effects of price promotions oncustomer evaluations in coffee chain stores. International Journal of Contemporary Hospitality Management, 26(7),1065–1082
Olshavsky, R.W. (1985), “Perceived quality in consumer decisionmaking: an
integrated theoretical perspective”, in Jacobi, J. and Olson, J. (Eds), Perceived Quality, Lexington Books, Lexington, MA.
Tversky, Amos, & Kahneman, Daniel. (1981, January). The framing of
decisions and the psychology of choice. Science, 211, 453458.
Yin, X., & Huang, J. (2014). Efects of price discounts and bonus packs on
online impulse buying. Social Behavior & Personality: An International Journal, 42(8), 1293–1302.
Zeithaml, V. (1988), “Consumer perceptions of price, quality and value: a
means-end model and synthesis of evidence”, Journal of Marketing, Vol. 52, July, pp. 2-22.
1

客服QQ:30444492琼网文【2021】1550-113号
增值电信业务经营许可证:琼B2-20210322
出版物经营许可证:新出发龙华出字第(2021)009号
广播电视节目制作经营许可证:(琼)字第00779号
版权所有 ©2002-2024 期刊网(www.qikanchina.com) 琼ICP备2021005105号